BRC-SENSORMATIC FOOTFALL
MONITOR – DECEMBER
2024
The later timing of Black Friday in 2024 meant that it
falls into December's, rather than November's figures, while the
reverse was true in 2023. This worsens November figures and
improves the December figures. This effect is cancelled out in
the three month to December figure.
Covering the five weeks 24 November – 28 December
2024
According to
BRC-Sensormatic data:
-
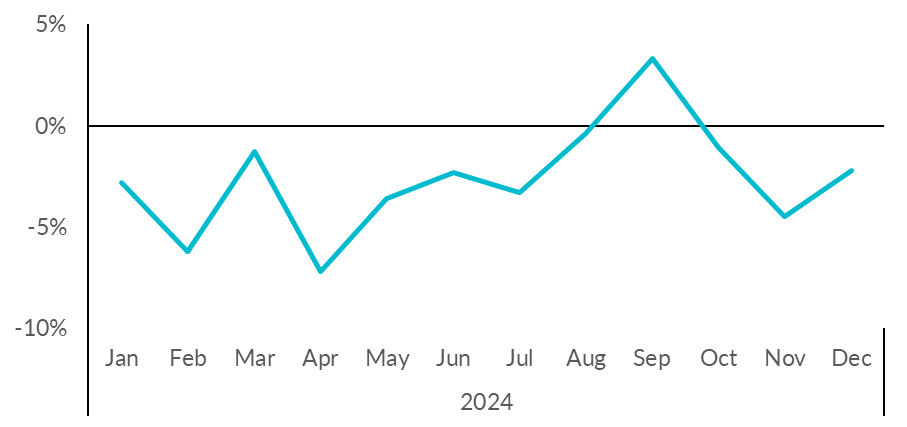
Overall, Total UK footfall in 2024 was down 2.2%
compared to 2023.
- For the three months to
December (Golden Quarter) footfall decreased by
2.5% (YoY)
-
Total
UK footfall decreased by 2.2%
in December (YoY), up from -4.5% in November.
-
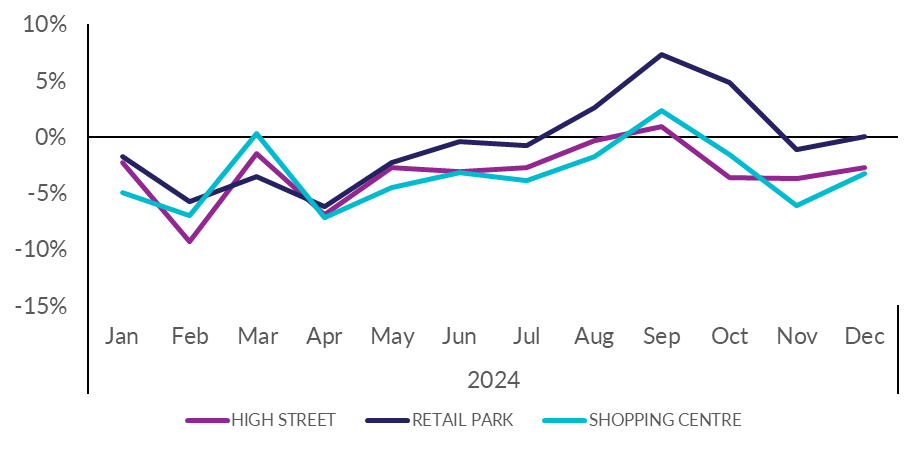
High
Street footfall decreased by
2.7% in December (YoY), up from -3.7% in November.
-
Retail
Park footfall unchanged at
0.0% in December (YoY), up from -1.1% in November.
-
Shopping
Centre footfall decreased by
3.3% in December (YoY), up from -6.1% in November.
- Footfall decreased year-on-year for all four nations,
with Scotland falling by
1.5%, England by
2.1%, Wales by 2.6%,
while Northern Ireland experienced the
biggest decline at 5.8%.
Helen Dickinson, Chief Executive of the British Retail
Consortium, said:
“A drab December which saw fewer shoppers in all locations,
capped a disappointing year for UK retail footfall. This means
2024 is the second year in a row where footfall has been in
decline. High streets and shopping centres were hit particularly
hard throughout the year as people veered towards retail parks to
take advantage of free parking and the variety of larger stores.
Even the Golden Quarter, typically the peak of shopping activity,
provided little relief, with footfall down over the period. While
the Black Friday weekend delivered more promising results, they
were overshadowed by a lacklustre festive season.
“Shopping habits have been changing fast and customers are
increasingly looking for more experiential shopping, as well as a
variety of cafes, services and things to do. Unfortunately,
investment in town centres and high streets is held back by our
outdated business rates system, which penalises town and city
centes. The Government's proposals to reform business rates may
ease the burden for some retailers, but it is vital that,
ultimately, no shop ends up paying more in rates than before.
With retailers facing £7 billion in additional costs this year
from increased tax and regulations, the changes to the business
rates system must be made in way that supports retail investment
and growth in the years ahead.”
Andy Sumpter, Retail Consultant EMEA for Sensormatic,
commented:
“While December saw some flurries of festive footfall around a
few key trading days, overall, the picture was filled with much
less sparkle as shopper traffic remained subdued in what should
have been the highlight of the Golden Quarter. While store
visits did build ahead of Christmas, it was never quite enough to
reverse the shopper count deficit against last year. As
footfall limped towards the festive finish line, December's
lacklustre performance compounds a disappointing end to 2024,
marking the second consecutive year of declining store traffic.
Retailers will now need to look afresh to 2025 and chart a
course to adopt innovative strategies to reverse this trend or
maximise the sales potential of fewer visitors, finding new ways
to make each store visit count.”
MONTHLY TOTAL UK RETAIL FOOTFALL (% CHANGE
YOY)

UK FOOTFALL BY LOCATION (% CHANGE
YOY)

TOTAL FOOTFALL BY NATION AND REGION
|
GROWTH RANK
|
NATION AND REGION
|
Dec-24
|
Nov-24
|
|
1
|
South East England
|
-1.1%
|
-2.0%
|
|
1
|
West Midlands
|
-1.1%
|
-6.1%
|
|
3
|
London
|
-1.2%
|
-2.1%
|
|
4
|
North West England
|
-1.4%
|
-3.3%
|
|
5
|
Scotland
|
-1.5%
|
-6.8%
|
|
6
|
England
|
-2.1%
|
-4.2%
|
|
7
|
Wales
|
-2.6%
|
-7.1%
|
|
8
|
East Midlands
|
-2.7%
|
-6.2%
|
|
9
|
Yorkshire and the Humber
|
-2.9%
|
-9.1%
|
|
10
|
North East England
|
-3.3%
|
-9.0%
|
|
11
|
East of England
|
-3.4%
|
-1.8%
|
|
12
|
South West England
|
-4.8%
|
-4.7%
|
|
13
|
Northern Ireland
|
-5.8%
|
-2.8%
|
TOTAL FOOTFALL BY CITY
|
GROWTH RANK
|
CITY
|
Dec-24
|
Nov-24
|
|
1
|
Birmingham
|
4.8%
|
-4.7%
|
|
2
|
Glasgow
|
0.2%
|
-9.4%
|
|
3
|
Edinburgh
|
-1.1%
|
-5.6%
|
|
4
|
London
|
-1.2%
|
-2.1%
|
|
5
|
Leeds
|
-3.0%
|
-10.8%
|
|
5
|
Manchester
|
-3.0%
|
-2.0%
|
|
7
|
Nottingham
|
-3.3%
|
-7.4%
|
|
8
|
Cardiff
|
-3.5%
|
-8.6%
|
|
9
|
Liverpool
|
-3.8%
|
-5.5%
|
|
10
|
Belfast
|
-7.2%
|
-2.3%
|
|
11
|
Bristol
|
-7.5%
|
-7.8%
|
