Living standards are set to return to the depths experienced
during the cost-of-living crisis by the end of this parliament,
with those on the lowest incomes faring the worst. New modelling
from the Joseph Rowntree Foundation shows that poverty is set to
rise for all family types except pensioners.
The analysis shows families with children will see the biggest
hit to their disposable incomes, with 100,000 more children set
to be in poverty by October 2029 compared to today along with
300,000 more working-age adults.
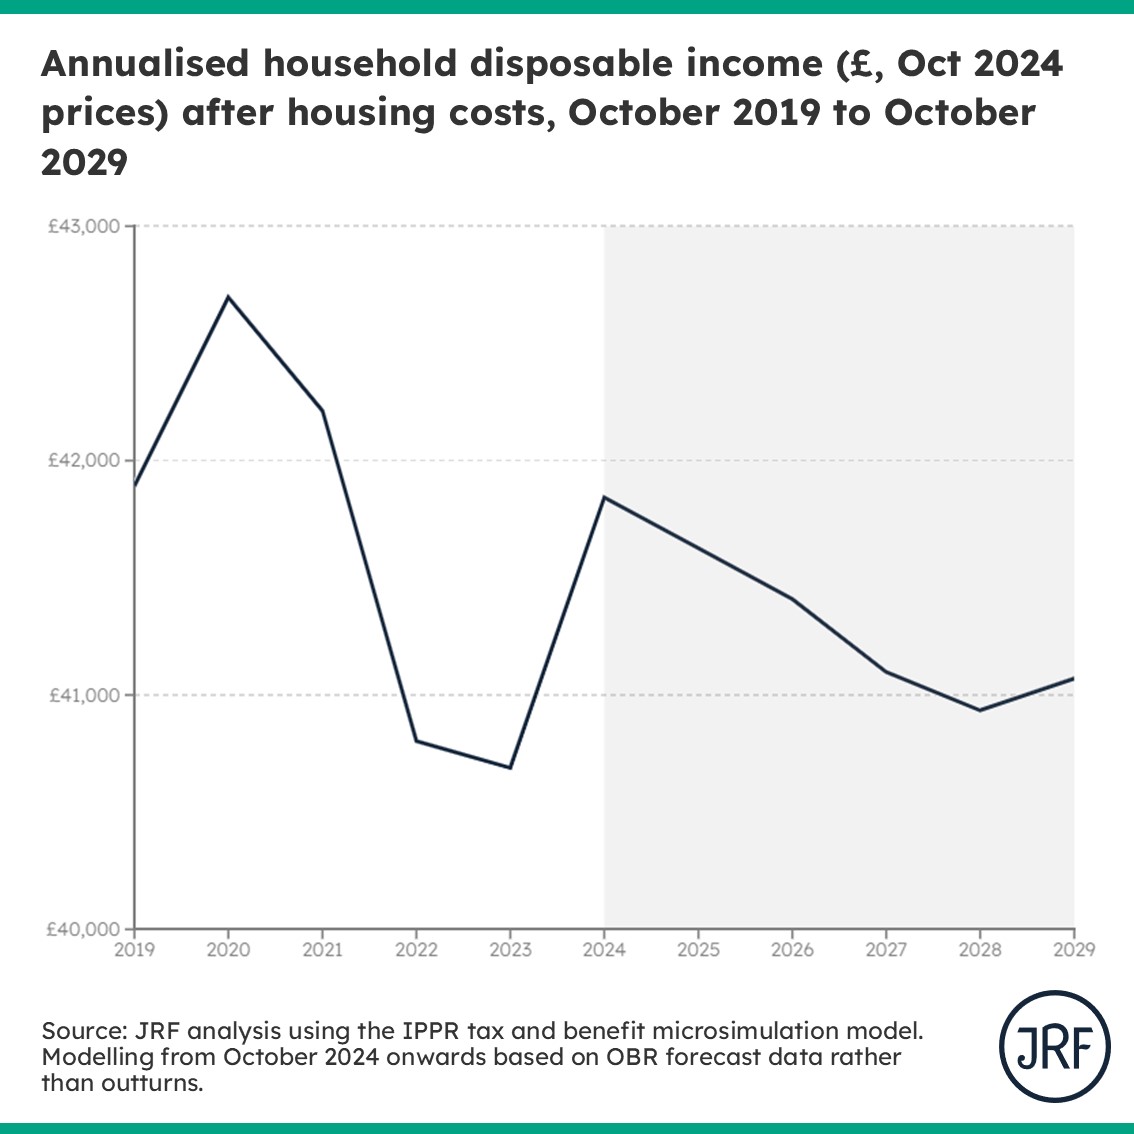
The average family will be £770 worse off in real
terms by October 2029 compared with today (October
2024).
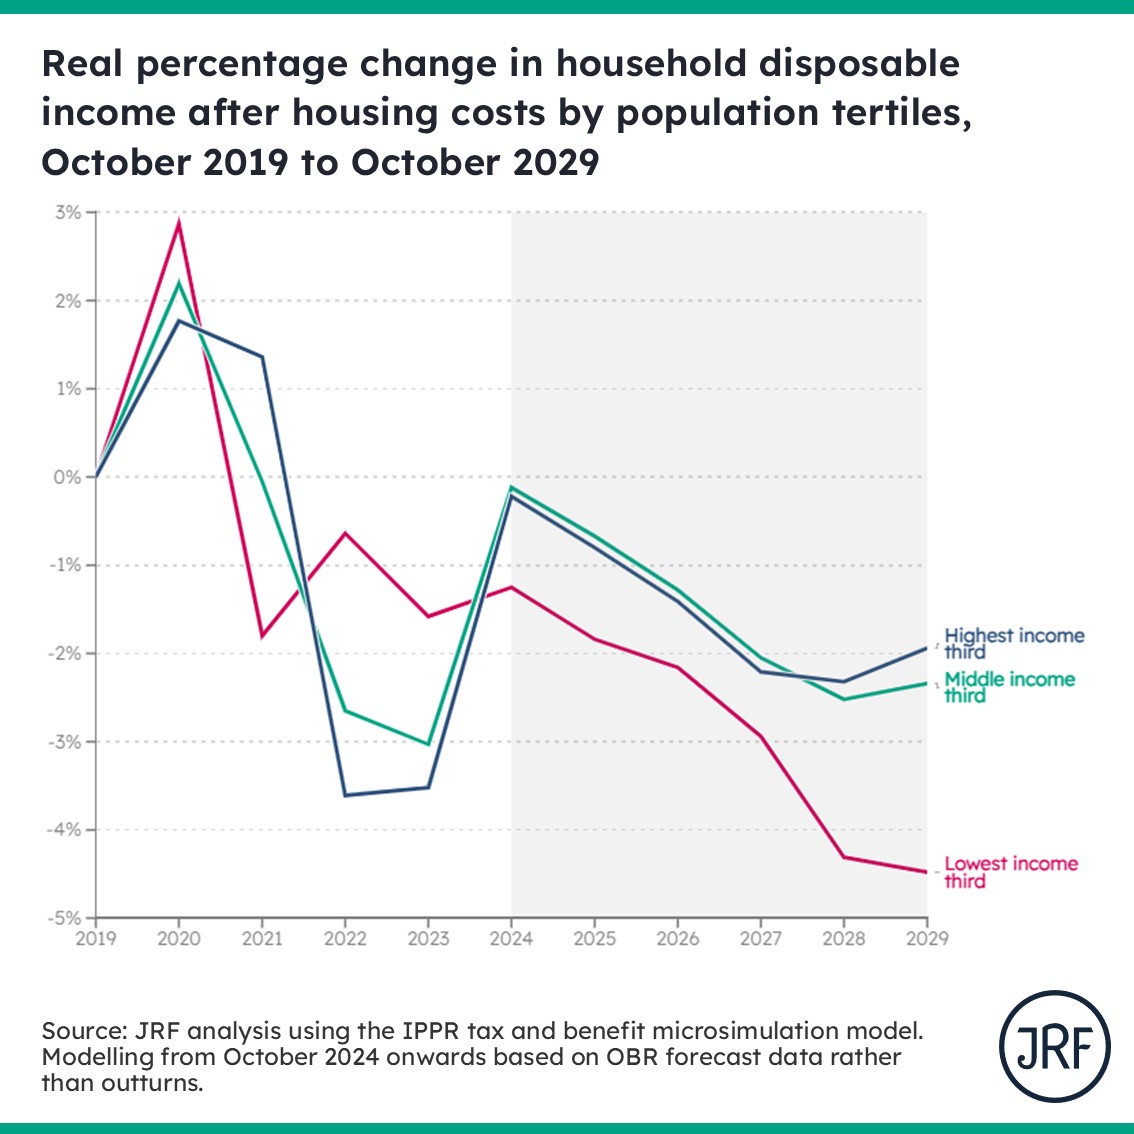
Alongside this inequality is set to rise. The poorest
third of households will see their real disposable incomes fall
by 3.3% between today and October 2029, while the highest income
third see a fall of 1.7%.
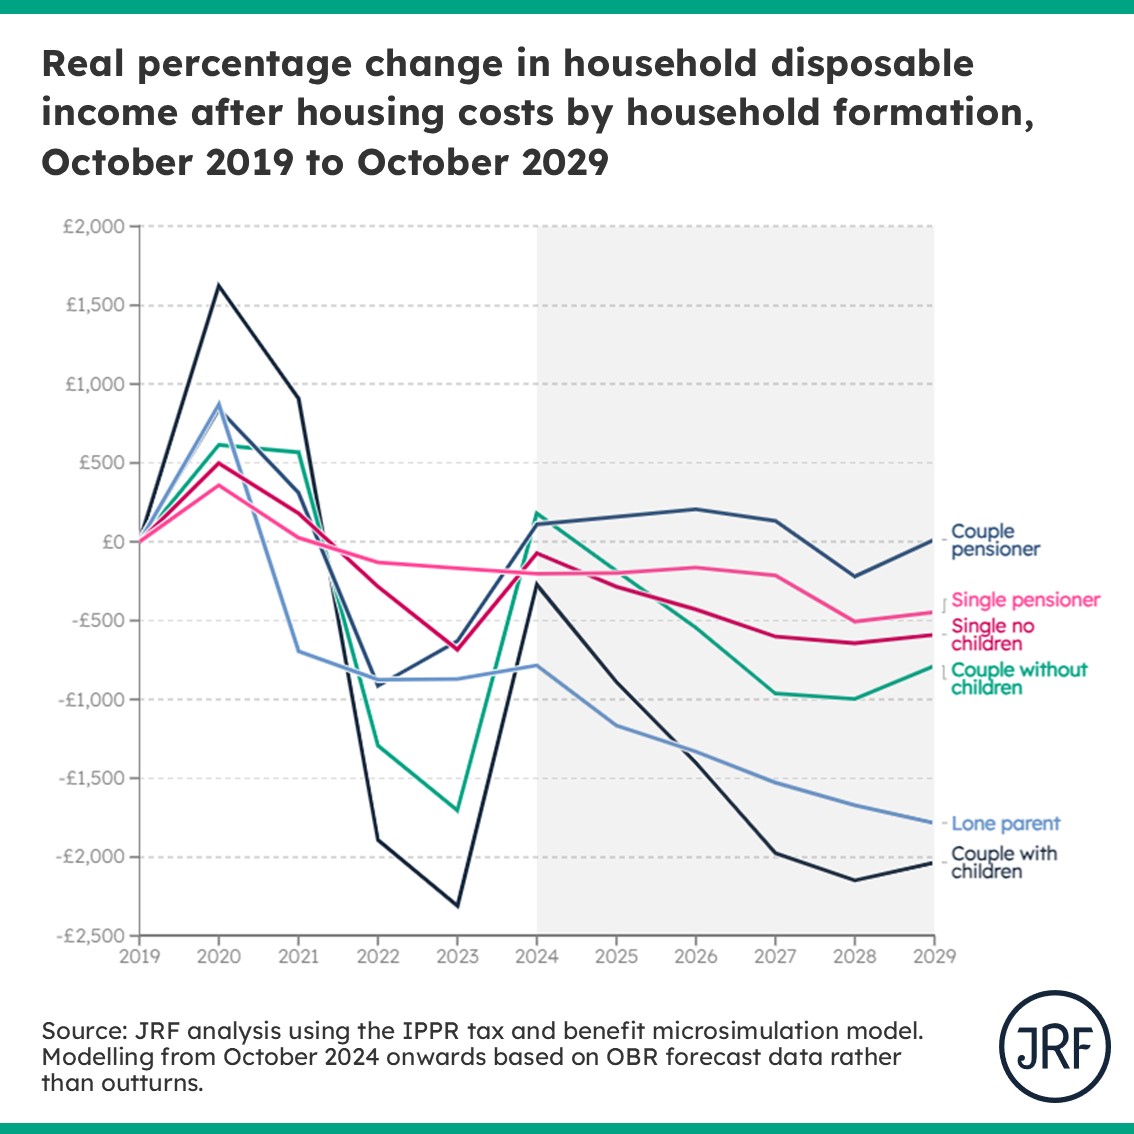
Single parent families will be £1,000 worse off on
average by October 2029 compared to now, with couples with
children worse off by £1,760.
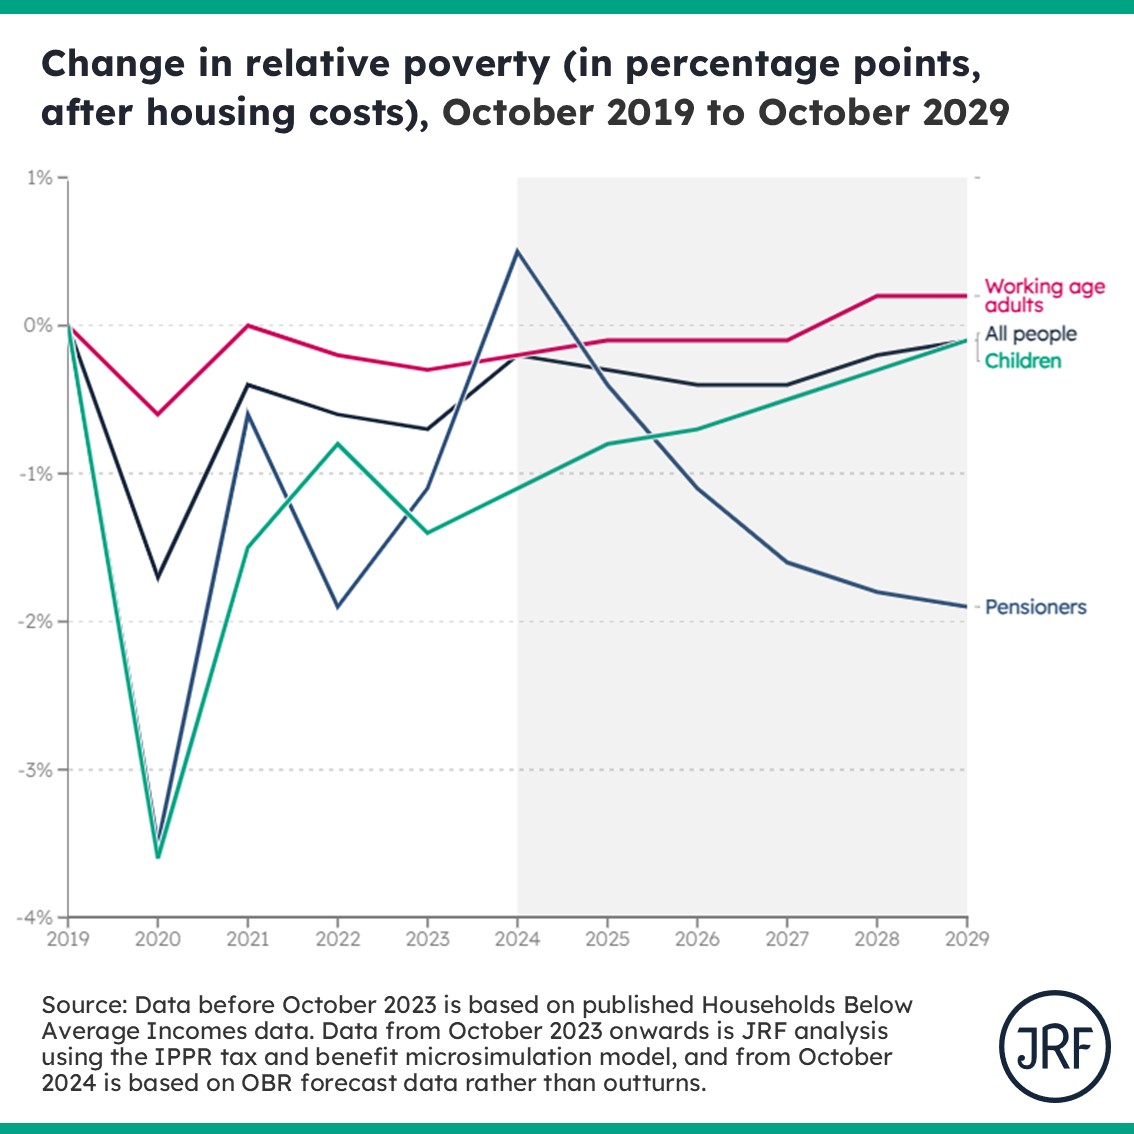
Relative poverty is set to rise for children and
working-age adults, with only pensioner households seeing a fall.
100,000 more children are set to be in poverty by October 2029
compared with October 2024 along with 300,000 working-age adults.
Notes to Editor
Modelling
methodology
The modelling analysis in this report
uses the Family Resources Survey (2022/23), the IPPR Tax-Benefit
Model, and the latest OBR economic forecasts to project household
income, housing, and tax expenditure for October of each forecast
year. All projected household incomes and housing costs are
converted into 2024 Q4 prices.
Tertiles: based on equivalised household income after housing
costs, and set at person level, such that a third of people are
in each tertile.
National Living
Wage: our
modelling ensures no adult earns less than the NLW. Due to
limitations in the survey data we are likely to slightly
over-estimate the number of workers currently working for the NLW
and therefore the impact of NLW
increases.
Poverty: Relative poverty After Housing Costs, i.e. where someone's
household income is below 60% of the middle household's income,
adjusted for family size and
composition.
Policies: We have
included as many policy changes we can. Note some changes are not
modellable or do not have sufficient detail to be
included.