Covering the four weeks 30 June 2024 –
27 July 2024
According to BRC-Sensormatic IQ
data:
-
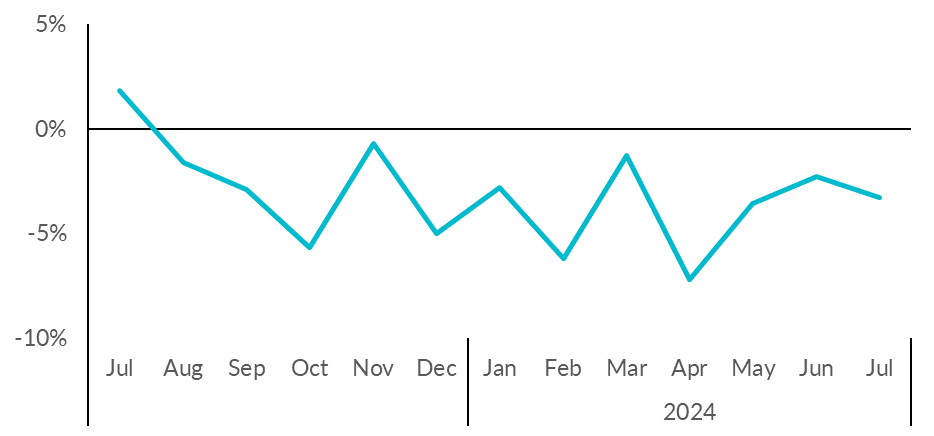
Total UK footfall decreased by 3.3%
in July (YoY), down from -2.3% in June.
-
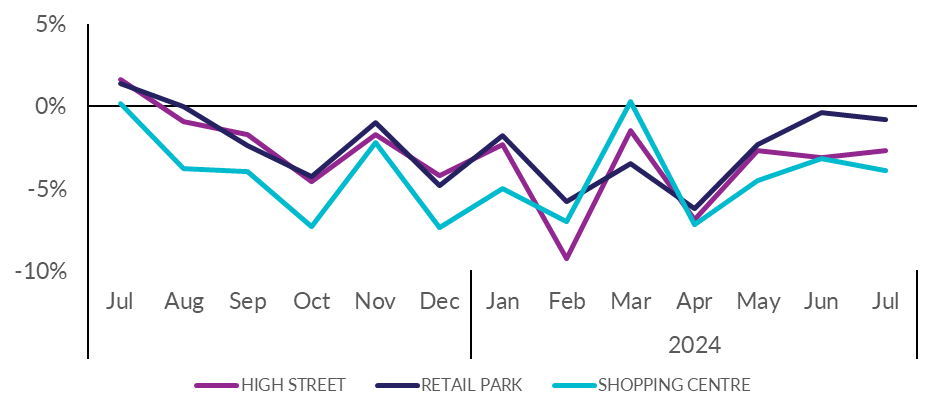
High Street footfall increased by
2.7% in July (YoY), up from -3.1% in June.
-
Retail Park footfall decreased by
0.8% in July (YoY), down from -0.4% in June.
-
Shopping Centre footfall
decreased by 3.9% in July (YoY), down from -3.9%
in May.
- All UK nations saw a fall in footfall year on year:
-
Scotland decreased by 2.3% YoY
-
Northern Ireland decreased by 2.2% YoY
-
England decreased by 3.4% YoY – the
largest fall in footfall
-
Wales decreased by 3.2% YoY
Helen Dickinson, Chief Executive of the British Retail
Consortium, said:
“Footfall declined for the twelfth consecutive month, failing to
maintain the buoyancy seen in 2022/23. As summer got into full
swing, many people have chosen to increase their spending on
holidays and leisure activities rather than shopping. Election
week also saw particularly weak footfall, as political
electioneering peaked, creating uncertainty for many consumers.
“With the election now over, many retailers will be making
decisions about how and where to invest in the coming years.
Retailers welcomed Labour's promises to reform both business
rates and planning laws – two major factors that often hold back
much needed local investment. If Labour can address these
effectively, they could help breathe new life into retail
destinations.”
Andy Sumpter, Retail Consultant EMEA for Sensormatic
Solutions, commented:
“Despite a warmer and drier month compared to the wash-out that
was June, July's footfall faltered with shopper traffic falling
back to the same levels we saw in May. As we approach a
full year of seeing footfall yo-yo in its ongoing recovery, it's
clear the longtail of the cost-of-living crisis is continuing to
rattle consumer confidence and is likely to prompt spending
caution for some time to come, making each in-store conversion
all the harder won. With election fever now over and the
school holidays now in full swing, retailers will be hoping that
spells a positive outlook for store performance in the months to
come.”
MONTHLY TOTAL UK RETAIL FOOTFALL (% CHANGE
YOY)
UK FOOTFALL BY LOCATION (% CHANGE YOY)
TOTAL FOOTFALL BY
NATION AND REGION
|
GROWTH RANK
|
NATION AND REGION
|
Jul-24
|
Jun-24
|
|
1
|
London
|
-1.4%
|
-2.5%
|
|
2
|
North West England
|
-1.8%
|
-0.8%
|
|
3
|
Northern Ireland
|
-2.2%
|
-0.6%
|
|
4
|
Scotland
|
-2.3%
|
+0.2%
|
|
5
|
North East England
|
-2.7%
|
+0.2%
|
|
5
|
Wales
|
-3.2%
|
-4.1%
|
|
7
|
East of England
|
-3.4%
|
-1.4%
|
|
8
|
England
|
-3.4%
|
-2.6%
|
|
9
|
West Midlands
|
-3.6%
|
-4.0%
|
|
10
|
East Midlands
|
-4.1%
|
-3.5%
|
|
11
|
South East England
|
-5.0%
|
-5.0%
|
|
12
|
Yorkshire and the Humber
|
-5.4%
|
-2.1%
|
|
13
|
South West England
|
-6.0%
|
-2.2%
|
TOTAL FOOTFALL BY CITY
|
GROWTH RANK
|
CITY
|
Jul-24
|
Jun-24
|
|
1
|
Edinburgh
|
+1.4%
|
+2.4%
|
|
2
|
Liverpool
|
+0.9%
|
+1.1%
|
|
2
|
Belfast
|
+0.3%
|
+3.7%
|
|
4
|
London
|
-1.4%
|
-2.5%
|
|
5
|
Manchester
|
-2.7%
|
-0.9%
|
|
6
|
Leeds
|
-2.8%
|
-2.1%
|
|
7
|
Cardiff
|
-3.9%
|
-5.1%
|
|
8
|
Nottingham
|
-4.6%
|
-3.1%
|
|
9
|
Glasgow
|
-4.8%
|
+2.2%
|
|
10
|
Birmingham
|
-5.9%
|
-4.0%
|
|
11
|
Bristol
|
-7.1%
|
-3.5%
|
-ENDS-
Methodology:
All figures are calculated using precise shopper numbers entering
retail stores across the UK, whichever destination they are
located.
While High Streets, Shopping Centres and Retail Parks are the
main components of the Total Footfall, there are also additional
categories not included as separate indices. These include
outlets, travel hub locations, and free standing locations such
as garden centres.