Covering the five weeks 29 December 2024 – 01 February
2025
According to
BRC-Sensormatic data:
-
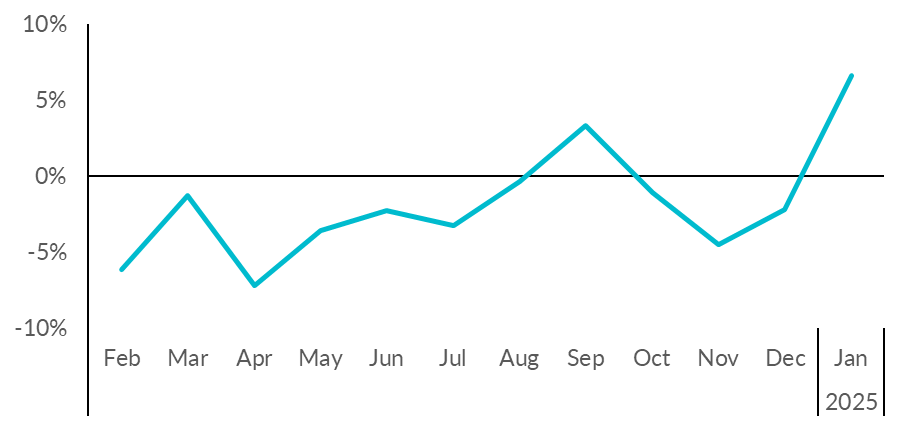
Total UK footfall increased by 6.6%
in January (YoY), up from -2.2% in December.
-
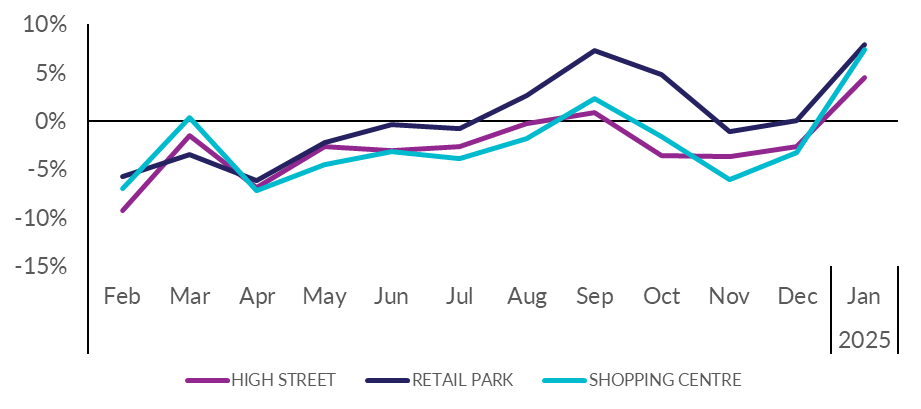
High Street footfall increased by
4.5% in January (YoY), up from -2.7% in December.
-
Retail Park footfall increased by
7.9% in January (YoY), up from 0.0% in December.
-
Shopping Centre footfall increased by
7.4% in January (YoY), up from -3.3% in December.
- Footfall increased year-on-year in all four UK nations, with
Wales improving by 8.5%,
Englandby 7.4%, Northern
Ireland by 3.5%, while Scotland
improved by 1.0%.
Helen Dickinson, Chief Executive of the British Retail
Consortium, said:
“Shopper footfall received a welcome boost in January following a
disappointing festive period. Store visits increased
substantially in the first week of the month as many consumers
hit the January sales in their local community, with shopping
centres faring particularly well. Despite snowy weather and Storm
Eowyn causing disruption in some areas, footfall was still
positive across major UK cities over the whole month.
“Improved shopper traffic is welcome news for high streets
following a particularly difficult ‘Golden Quarter' to end 2024,
and low consumer sentiment to start the year. Retailers want to
invest more in stores and staff to enhance the shopping
experience for customers and help to grow the economy, but the
swathe of additional costs from April will limit investment and
lead to job losses and higher prices at the tills. To drive
growth in communities across the country, the government must
ensure costs are limited in other areas. This can be done by
delaying packaging taxes and ensuring that business rates reform
leaves no shop paying more than they currently do.”
Andy Sumpter, Retail Consultant EMEA for Sensormatic,
commented:
“After a dreary December, retailers will welcome January's
footfall jump. The uptick was boosted by a very strong Week
1, helped in part by New Year's Day falling on a Wednesday, which
may have prompted ambient store traffic as consumers bolted on
additional days of leave, as well as retailers extending
post-Christmas discounting well into January. Not even the
significant disruption from Storm Eowyn was enough to dampen
overall footfall performance. While welcome, after
months of erratic and constrained footfall, the jury's out as to
whether January's store performance signals the start of a
sustained High Street revival or if it will be a flash in the pan
come February. And, even if shopper traffic recovery has finally
turned a corner, the challenge for retailers will be solving the
next conundrum; how they balance enhanced footfall – which
requires optimised store staffing to convert into sales – and the
significant rises to labour costs borne out of the Budget on the
one hand, with consumer appetite for discounts - a long-term
margin-eroder - on the other, which will not be an easy circle to
square.”
MONTHLY TOTAL UK RETAIL FOOTFALL (% CHANGE
YOY)
UK FOOTFALL BY LOCATION (% CHANGE
YOY)
TOTAL FOOTFALL BY NATION AND REGION
|
GROWTH RANK
|
NATION AND REGION
|
Jan-25
|
Dec-24
|
|
1
|
West Midlands
|
10.0%
|
-1.1%
|
|
2
|
South East England
|
9.4%
|
-1.1%
|
|
3
|
Wales
|
8.5%
|
-2.6%
|
|
3
|
East of England
|
8.5%
|
-3.4%
|
|
5
|
South West England
|
7.9%
|
-4.8%
|
|
6
|
North West England
|
7.7%
|
-1.4%
|
|
7
|
England
|
7.4%
|
-2.1%
|
|
8
|
North East England
|
6.8%
|
-3.3%
|
|
9
|
London
|
6.7%
|
-1.2%
|
|
10
|
East Midlands
|
6.4%
|
-2.7%
|
|
11
|
Northern Ireland
|
3.5%
|
-5.8%
|
|
12
|
Yorkshire and the Humber
|
3.3%
|
-2.9%
|
|
13
|
Scotland
|
1.0%
|
-1.5%
|
TOTAL FOOTFALL BY CITY
|
GROWTH RANK
|
CITY
|
Jan-25
|
Dec-24
|
|
1
|
Birmingham
|
14.3%
|
4.8%
|
|
2
|
Manchester
|
10.3%
|
-3.0%
|
|
3
|
Cardiff
|
9.1%
|
-3.5%
|
|
4
|
London
|
6.7%
|
-1.2%
|
|
4
|
Nottingham
|
6.7%
|
-3.3%
|
|
6
|
Bristol
|
6.2%
|
-7.5%
|
|
7
|
Belfast
|
4.8%
|
-7.2%
|
|
8
|
Liverpool
|
3.2%
|
-3.8%
|
|
9
|
Edinburgh
|
2.8%
|
-1.1%
|
|
10
|
Glasgow
|
1.9%
|
0.2%
|
|
11
|
Leeds
|
1.0%
|
-3.0%
|
-ENDS-
Methodology:
All figures are calculated using precise shopper numbers entering
retail stores across the UK, whichever destination they are
located.
While High Streets, Shopping Centres and Retail Parks are the
main components of the Total Footfall, there are also additional
categories not included as separate indices. These include
outlets, travel hub locations, and free standing locations such
as garden centres.