Covering the five weeks 27 August – 30
September 2023
According to BRC-Sensormatic IQ
data:
-
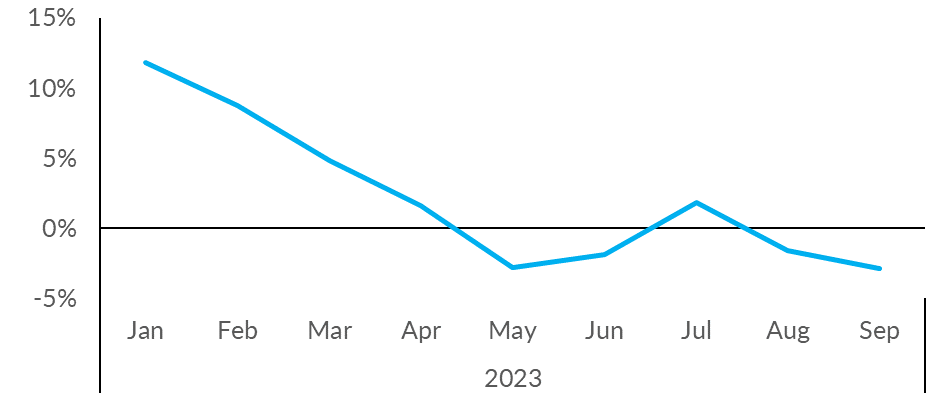
Total UK footfall decreased by 2.9%
in September (YoY), down from -1.6% in August.
-
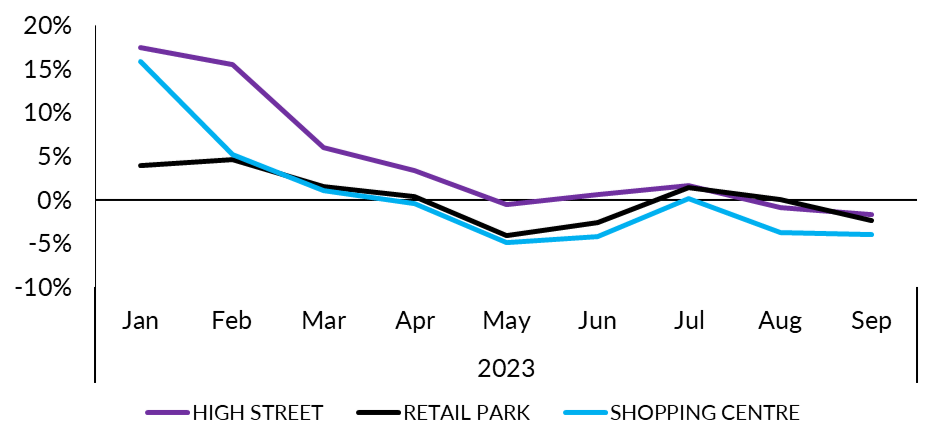
High Street footfall decreased by
1.7% in September (YoY), down from -0.9% in August.
-
Retail Parks footfall decreased by 2.4% in
September (YoY), down from 0.0% in August.
-
Shopping Centre footfall
decreased by 4.0% in September (YoY), down from
-3.8% in July.
- Of the UK nations, Scotland saw a YoY rise
in footfall, showing an increase of +1.0%. Conversely,
Wales saw a YoY drop in footfall, a decrease of
1.4%. This was followed by England at -2.9% and
Northern Ireland at -3.6%.
Helen Dickinson, Chief Executive of the British Retail
Consortium, said:
“During the warmer-than-expected weather, footfall slowed in
September, with fewer shoppers across all shopping locations.
High streets and retail parks held up slightly better as the
return to school helped increase the number of shopping visits at
the start of the month. Retailers will want to invest in their
properties in the run up to Christmas, but the prospect of a
£400m increase to business rates next year will limit their
capacity for improvements. The Chancellor should announce a
freeze to rates at the Autumn Budget in November.”
Andy Sumpter, Retail Consultant EMEA for Sensormatic
Solutions, commented:
“Rather than the traditional
‘Back To School’ boost to shopper traffic we would normally
expect to see in September, footfall remained subdued as consumer
caution on discretionary spending stayed high, perhaps prompted
by shoppers withholding spend to save ahead of the Golden Quarter
and Christmas. While retailers will be hoping this month’s
first fall in food prices in two years will mark the beginning of
the end of inflationary-driven pressure on household budgets,
many will recognise that the reality of inflationary-driven
interest rates – and consequently higher mortgages and rent
payments - will be with us ‘higher and for longer’, meaning once
again retailers will be required to run faster just to stand
still.”
MONTHLY TOTAL UK RETAIL FOOTFALL (% CHANGE
YOY)
UK FOOTFALL BY LOCATION (% CHANGE YOY)
TOTAL FOOTFALL BY NATION AND REGION
|
GROWTH RANK
|
NATION AND REGION
|
Sep-23
|
Aug-23
|
|
1
|
Scotland
|
1.0%
|
0.4%
|
|
2
|
North East England
|
-0.5%
|
1.0%
|
|
3
|
London
|
-0.9%
|
2.5%
|
|
4
|
Wales
|
-1.4%
|
-1.7%
|
|
5
|
North West England
|
-2.5%
|
-1.6%
|
|
6
|
England
|
-2.9%
|
-1.3%
|
|
7
|
East Midlands
|
-3.1%
|
-4.0%
|
|
8
|
West Midlands
|
-3.1%
|
-4.0%
|
|
9
|
Northern Ireland
|
-3.6%
|
-4.7%
|
|
10
|
South East England
|
-3.7%
|
-2.4%
|
|
11
|
South West England
|
-4.3%
|
-2.0%
|
|
12
|
Yorkshire and the Humber
|
-5.7%
|
-4.0%
|
|
13
|
East of England
|
-7.3%
|
-5.4%
|
TOTAL FOOTFALL BY CITY
|
GROWTH RANK
|
CITY
|
Sep-23
|
Aug-23
|
|
1
|
Edinburgh
|
7.5%
|
5.7%
|
|
2
|
Liverpool
|
3.4%
|
4.7%
|
|
3
|
London
|
-0.9%
|
2.5%
|
|
4
|
Manchester
|
-1.4%
|
1.1%
|
|
5
|
Cardiff
|
-2.0%
|
-1.5%
|
|
6
|
Bristol
|
-2.6%
|
-0.3%
|
|
7
|
Glasgow
|
-2.9%
|
-3.2%
|
|
8
|
Belfast
|
-3.9%
|
-6.2%
|
|
9
|
Birmingham
|
-4.3%
|
-5.4%
|
|
10
|
Nottingham
|
-4.6%
|
-5.4%
|
|
11
|
Leeds
|
-5.4%
|
-1.0%
|
-ENDS-
Methodology:
All figures are calculated using precise shopper numbers entering
retail stores across the UK, whichever destination they are
located.